
Setting customer experience metrics might be the least fun part of your role. But it shouldn’t stress you out or take up all your time.
After all, tracking the right metrics is essential for helping you and your team get a clear idea of where you’re standing and what needs improvement. The metrics you set should all focus on helping you better your operational and strategic decision making as well as guiding your future plans effortlessly.
Before we jump into the customer experience metrics, let’s clarify how you should choose these.
How do you choose which metrics to track?

There are three core outcomes each metric should help you with:
- Improve customer satisfaction
- Increase the overall efficiency of operations
- Track and improve agent performance
If a metric doesn’t help you reach all of these goals, you should leave tracking it for later.
Relevant metrics for measuring customer experience should also help you decide exactly:
- What operational data you should measure
- How the measuring process works
- When the best time to collect and track these metrics is
Additionally, it’s important to consider how these metrics interact with each other. Understanding how they fit together can give you a better understanding of how your business is performing overall.
Top 7 metrics for measuring customer experience

Get ready to take notes on the most important customer experience measurement metrics, how you can use them, and how to calculate each.
1. Customer Satisfaction Score (CSAT)
Improving your customer retention rate by just 5% can generate as much as 25% to 95% higher profits. The CSAT score is a numerical representation of customer sentiment and how satisfied existing customers are with your support.
To calculate CSAT, start by determining what counts as a “satisfied” customer. For example, ratings between 6-10 out of 10. Then take the number of those customers and divide it by the total number of customers who filled out the survey. Multiply that ratio by 100 to get your final score. You can also keep track of this number over time to measure progress.
CSAT= Total number of satisfied customers ÷ Total number of responses x 100
Remember: You can also use a CSAT score to boost your brand’s reputation, reduce churn, get more repeat business, and differentiate yourself from competitors. In fact, the score is used by multiple departments like marketing, sales, and product. That’s why it doesn’t give you a fully accurate look at your agents’ performance. To get a closer look into how support is impacting your CSAT metric, leverage quality insurance as part of your customer service management efforts.
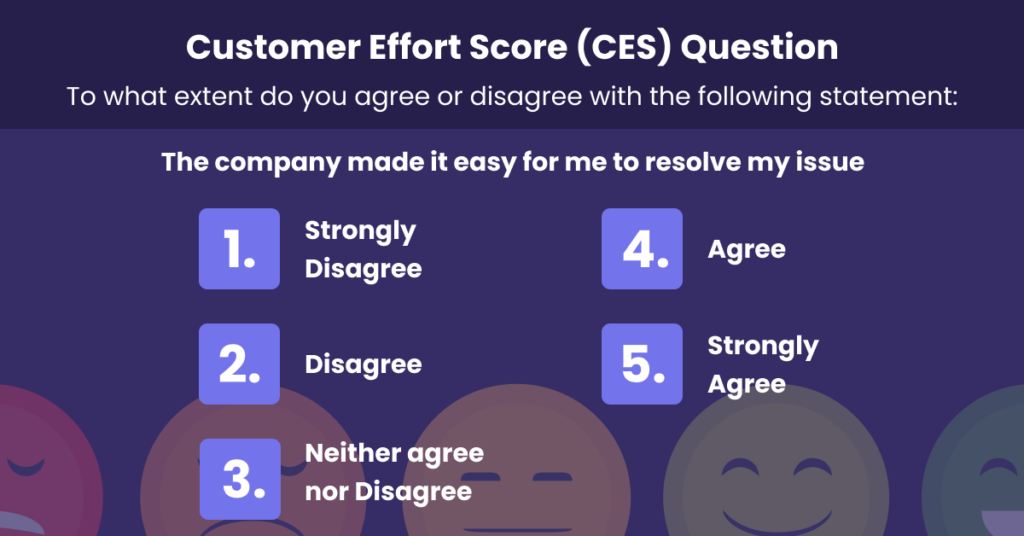
2. Customer Effort Score (CES)
The customer effort score (CES) is a measure of the amount of effort required on the part of customers to achieve their desired outcomes. This can range from answering questions to purchasing or returning products and resolving issues.
This customer experience metric helps you determine how easy your company makes it for customers to solve their problems and achieve their goals, especially compared to your competitors. If you have a lower CES than your competitor, your company is doing something right!
To calculate it, you’ll need to pick among a series of different surveys based on either the Likert scale, a 1-10 scale, a 1-5 scale, or the classic emojis scale. Here’s an example of a 1-5 scale used to measure CES:
(Total sum of responses) ÷ (Number of responses) = CES
3. Net Promoter Score (NPS)
The Net Promoter Score (NPS) gives you a clear picture of customer satisfaction and how likely customers are to recommend your company. This number tells you how successful your company is at creating a positive experience for customers, helping you understand what areas to focus on in order to increase customer loyalty.
Measure your NPS by asking customers to rate their likelihood of recommending your product or service on a scale from 1-10. 1 means they’re not likely to recommend, while 10 would be a definite recommendation. The NPS score is determined by subtracting the portion of detractors from the portion of promoters. The higher the number, the better.
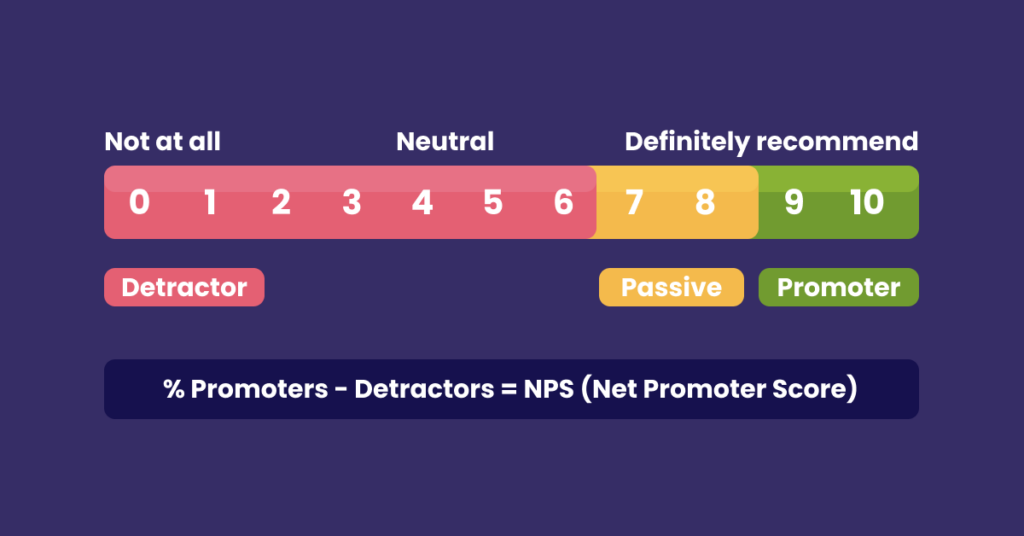
Practical example: Assume 15% of your customers are detractors and 30% are promoters, your NPS would be 15. As long as the score’s above zero, you’re doing things right and don’t have much to worry about. But remember you should re-check your score annually or every other quarter if you’ve got loads of changes going on around your product.
4. First Response Time (FRT)
Also known as First Reply Time, the First Response Time (FRT) is a key customer experience metric used in customer service to measure the passage of time between the point when a customer submits an inquiry and when they receive a response from your agents.
To ensure accuracy, make sure its measurement only happens within business hours. This will give you a look at how quickly and efficiently your support team is responding to customers, helping improve the customer experience.
To get the FRT score, divide the total time spent on all resolved cases by the number of cases that were successfully completed.
FRT= Total time waiting for all inquiries ÷ Total number of inquiries
5. Customer Lifetime Value (CLV)
Customer Lifetime Value (CLV) is used to calculate the revenue that a customer will generate during the time they’re your company’s customer. This is one of the best customer experience metrics as it has many added benefits like:
- It accounts for multiple factors.
- It gives insight into the average time a customer stays on with the brand or product.
- It can also be used to estimate the potential revenue from a potential new customer in advance.
CLV is calculated by multiplying the average purchase value, average purchase frequency, and average customer lifespan.
CLV = Average Purchase Value X Average Purchase Frequency X Average Customer Lifespan
6. Customer Health Score
The Customer Health Score is a measure of how healthy a customer’s account is. This customer experience metric is used to identify accounts that have the greatest potential for future profitability and the best chance of renewal.
There’s no formula for calculating Customer Health Score. Instead, it’s more like an educated guess you take by looking at fundamental data like:
- The depth of a product: How many features are people actually using?
- The breadth of a product: How many customers who signed up for each account are actively using it?
- The frequency of a product: How often do people use your tool or app? How much time do they spend on it?
- Other in-app actions: How many people are using your in-app chat? How many users have upgraded their plans? How many add-ons did they get?
7. Customer Churn Rate
Tracking the customer churn rate is essential for understanding customer loyalty and overall business performance. It’s calculated by looking at the number of customers that discontinue their purchases over a given period of time. This is typically expressed as a percentage and helps paint an overarching picture of customer satisfaction.
We recommend choosing specific periods of time and dividing the total number of customers you lost by the total of those you gained. Lastly, multiply the result by 100 to get the percentage score.
Customer Churn Rate = (Lost customers ÷ Gained customers) X 100
Practical example: If you got 500 new customers in Q3, and you lost 50 in the process, your churn rate is (50 / 500) x 100 = 10%.
Bringing all key customer experience metrics together
You’ll have to track all of these metrics for measuring customer experience
to identify all friction points and improve the customer experience. But everything can be automated so you can spot issues in real-time, analyze customer feedback, and meet customer expectations faster.
Start by taking a look at your support team’s Scorecards to get a 360° view of your agents’ performance and entire relationship with potential and existing customers. You’ll be able to spot customer drop-off points and take a closer look at how support interactions are happening.
Try Kaizo to get a better grip on your business metrics and improve customer service quality from the first weeks using a gamified approach.
