Call center reports show how a support team is performing on speed, resolution, customer satisfaction and quality, for agents, team leads and executives. Automated reporting collects that data from your help desk and QA tools and refreshes the reports on a schedule, so team leads stop rebuilding the same spreadsheet every week.
In short
- Good call center reports answer different questions for different readers: agents, team leads and executives each need their own view.
- Manual reporting costs team leads hours a week and is error prone, because data sits in several tools and gets copied by hand.
- Automating starts with one definition per metric, one source of truth and a fixed schedule, not with a new dashboard.
- Quality data belongs in the report next to speed metrics, or the team optimizes for speed alone.
- Truecaller saved managers more than 20 hours a week on performance assessment after moving to automated performance data.
What is automated reporting in a call center?
Automated reporting in a call center is the practice of letting software collect, calculate and present support metrics on a schedule, instead of a team lead exporting data from several tools and building reports by hand. The reports refresh by themselves, use the same metric definitions every time and reach the right reader without a weekly assembly job.
In practice, reporting automation pulls data from the systems a support team already uses, such as the CRM, the ticketing platform and social media channels. It then tracks metrics like response times, resolution rates and customer satisfaction scores, and shows trends and outliers as they appear.
The point is not prettier charts. It is time and trust: the team lead gets hours back, and everyone reads the same numbers. For the wider picture of which customer service metrics to report and to whom, see our guide to customer service analytics.
What should call center reports include?
Call center reports should include a small set of metrics per reader, each with a clear definition and target. Daily reports cover volume and speed for the floor, weekly reports cover agent and team performance including quality, and monthly reports show trends and causes for leadership. Every report should lead to a decision, not just describe the week.
A common split looks like this:
| Report | Reader | What it shows | Typical metrics |
|---|---|---|---|
| Daily operations | Team leads, workforce planners | Whether today’s queue is under control | Volume, backlog, response time, service level |
| Weekly team and agent | Team leads, agents | Who needs coaching and on what | Resolution rate, handle time, CSAT, QA score per agent |
| Monthly quality | Support managers, QA leads | Whether quality is improving and why | QA score trend, top failure reasons, coaching completed |
| Quarterly executive | VP, CFO, board | Cost, risk and retention | Trend with a cause, cost per contact, customer satisfaction |
Speed metrics without a quality metric next to them push agents to close conversations fast rather than well. If you are deciding which quality metrics to put in the weekly report, our list of call center QA metrics covers the ones that predict customer satisfaction. For the executive version, see customer service reporting for executives.
Why does manual call center reporting break down?
Manual call center reporting breaks down because the data lives in too many tools, copying it by hand introduces errors, and the team lead who builds the report is also the person who should be coaching. As data volumes grow, the weekly spreadsheet takes longer, gets less reliable and creates security risks when files travel by email.
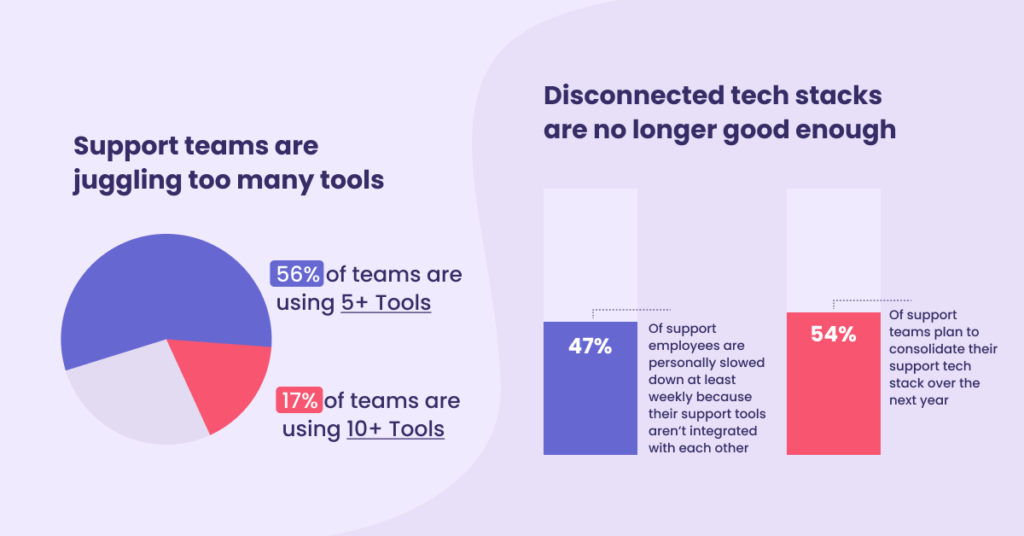
Too many tools. According to Intercom’s Customer Service Trends 2022 report, 47% of support teams say unintegrated tools are slowing down their workflow. 56% of teams use 5 or more tools and another 17% use more than 10 tools. Not all of these tools can export raw data, which creates information silos and more work for the leads responsible for reporting.
Errors. Manual reporting needs a level of focus and precision that is hard for anyone, let alone a team lead in a chronically understaffed industry. The strain of call center work without human-friendly tools has been linked to visual processing issues and eye strain. Research on spreadsheets found that 88% of spreadsheets contain errors.
Data security. Zendesk’s CX Trends 2020 report shows that companies are handling 3x more data than in previous years. Sending spreadsheets from person to person over email adds risk, and attachments that look like Excel files are a common route for phishing scams. Companies that do not protect customer data can face legal action and penalties.
Lost time for coaching. Every hour spent building a report is an hour not spent with agents. Agents also lose motivation when they get feedback based on metrics they cannot see themselves.
How do you automate call center reporting?
To automate call center reporting, agree on one definition per metric, connect your help desk and QA data to a single reporting tool, build one report per reader, and schedule it. Start with the report that costs the most manual time each week, prove it is trusted, then move on to the next one.
- List the reports you build today. Note who reads each one, how often, and how long it takes to make. The weekly agent report is usually the most expensive.
- Write down one definition per metric. Decide exactly how resolution rate, response time and QA score are calculated, so the automated number matches what people expect.
- Pick one source of truth. Connect the ticketing platform and your QA data to one place, so nobody reconciles two versions of the same number.
- Build one view per reader. Agents see their own results, team leads see their team, and executives see trends with a cause. Our call center reporting tools page shows what that looks like in Kaizo.
- Schedule and alert. Send reports on a fixed cadence and flag outliers as they happen, instead of waiting for the monthly review.
- Retire the old spreadsheet. Once the automated report is trusted, stop building the manual one, or both versions will drift apart.
Worked example: a team lead who spends Monday morning exporting tickets, pasting QA scores into a sheet and emailing it to five agents can replace all three steps. Each agent sees their own scores and trends whenever they want, and the team lead opens a team view to choose who to coach that week.
What does automated reporting look like in practice?
Automated reporting in practice means team leads see performance data continuously instead of assembling it, and agents see their own results. Two Kaizo customers show the effect: Truecaller cut the time spent on performance analysis by 75%, and Foot Locker Europe used the visibility to cut resolution time by 75% during a period of record volume.
Truecaller. Truecaller, a caller ID app with over 500 million installs, had an outdated, manual performance assessment process that cost managers a lot of time. Kaizo replaced that cycle with automated performance data, so the analysis that used to take a manager most of a week was available continuously.
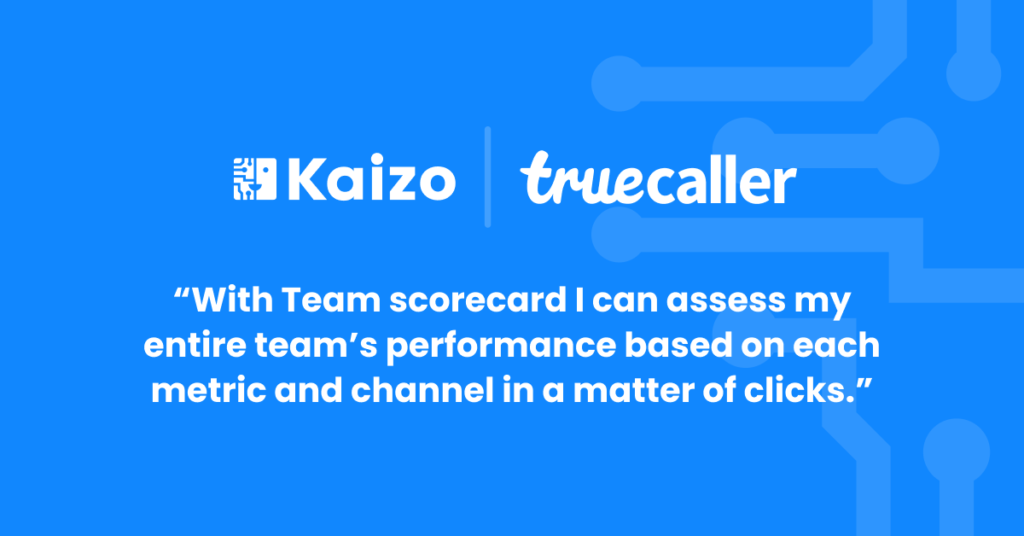
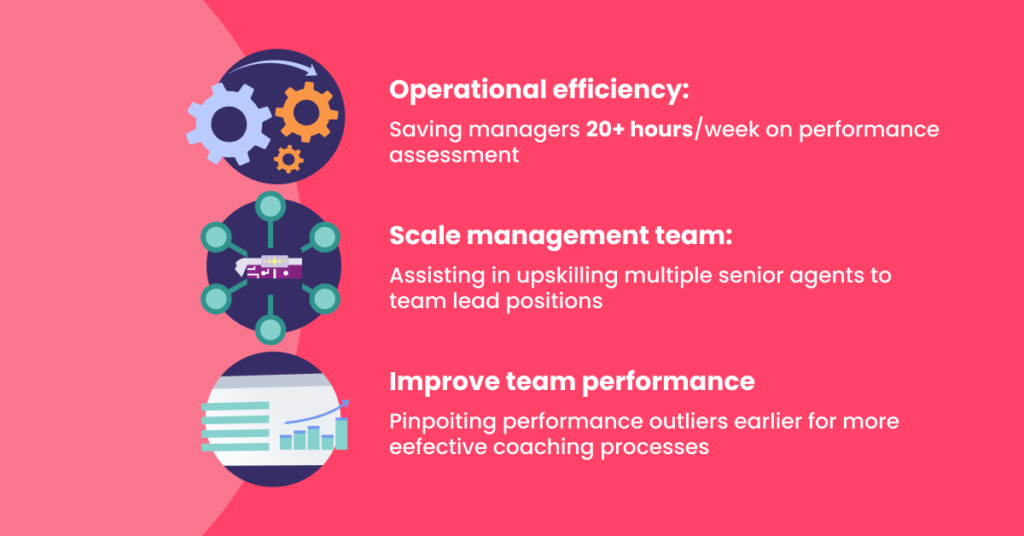
After 18 months on Kaizo, Truecaller had cut performance analysis by 75% and saved managers more than 20 hours a week. Giving agents access to their own performance data and flagging outliers earlier made coaching more effective. The team used the freed capacity to upskill several senior agents into team lead positions.
Foot Locker Europe. In 2020, Foot Locker Europe saw volumes more than double while the whole care team moved to working from home. Kaizo gave the team visibility into how it was performing at management level and agent level, across multiple European languages, and helped find the root causes of the problems they faced.
Between 2020 and 2021, Foot Locker Europe cut resolution time by 75% and reply time by 37%, and CSAT in the European care center rose 13%.
See it on your own conversations. Kaizo scores 100% of your support conversations and turns the findings into coaching. Book a demo.
How does QA data fit into automated reports?
QA data fits into automated reports as the quality line next to speed and satisfaction: QA scores per agent and team, the criteria agents fail most often, and coaching completed. When quality scores refresh automatically from reviewed conversations, team leads can spot a drop in the same week instead of at the end of the month.
Kaizo’s support insights bring QA scores, quality trends, sentiment and coaching impact into one view, and compare teams to show whether a difference comes from the people or the process. If you need the data elsewhere, Kaizo’s automated exports send it to your BI tools on the Intelligence and Enterprise plans.
When a report shows a pattern, the next question is why. Our guides to root cause analysis and customer service insights cover how to go from a number to a fix.
When automated reporting is not the right choice
Automated reporting is more than you need when the team is small, the data lives in one tool and the weekly report takes minutes rather than hours. If your help desk’s built-in reports already answer your questions, and you have no scorecard or QA process yet, start there before buying a reporting tool.
Automation pays off once several people read reports built from several tools, or once the team lead spends hours a week on assembly. It also does not fix unclear metrics: if nobody agrees how resolution rate is calculated, automating it only spreads the disagreement faster. Write the definitions first.
Frequently asked questions
What is a call center report?
A call center report is a summary of how a support team is performing over a set period. It usually covers volume, speed, resolution, customer satisfaction and quality. Different readers need different reports: agents need their own results, team leads need their team, and executives need trends with a cause.
What are the most common types of call center reports?
The most common types are daily operations reports, weekly team and agent reports, monthly quality reports and quarterly executive reports. Each has a different reader and cadence. Keeping them separate stops one report from trying to answer every question at once.
How much time does automated reporting save?
It depends on how much is built by hand today. Truecaller saved managers more than 20 hours a week on performance assessment and cut performance analysis by 75% after moving to automated performance data in Kaizo.
Can agents see their own performance reports?
Yes, and they should. Agents lose motivation when they get feedback based on metrics they cannot see. Giving agents access to their own performance data played a significant role in Truecaller’s results with Kaizo.
What is the difference between reporting and analytics?
Reporting shows what happened, on a schedule, to a set reader. Analytics digs into why it happened and what to change. Automated reporting frees the time that analytics needs, because team leads stop assembling the numbers and start reading them.
Does automated reporting remove errors completely?
It removes the errors that come from copying and pasting data by hand, which matters because research found errors in 88% of spreadsheets. It does not fix unclear definitions or bad source data, so agree on how each metric is calculated before you automate it.
If manual reporting is eating your team leads’ week, book a demo and we will show you the reports Kaizo builds from your own support conversations.





